The inner core (IC) has been known to change over decades since the discovery of changing seismograms of repeating earthquakes1,7. The dominant interpretation of steady super-rotation over decades has been derived from temporal changes of up to tenths of a second in the difference in arrival times between PKIKP and later core phases in repeated earthquakes. The inferred rate of super-rotation has settled to about 0.05–0.15° per year, and motion in the past decade may have slowed8,9,10. Similar rates have been inferred from normal modes11, PKIKP coda wave changes12, IC-backscattered waves2,13,14 and antipodal core waveform changes15. Fluctuating and much faster motion has also been suggested16. Most recently, observation with medium-aperture, high-frequency arrays and individual stations has suggested that PKIKP coda waves from 1991 to 2017 changed over time primarily during the interval 2001 to 2003, which is interpreted as because of 0.5° IC rotation during that period and much less rotation at other times17.
Other studies suggest oscillating motion. The distinct six-year oscillation (SYO) in the length of day (LOD) could be explained by gravitational coupling of mantle density anomalies and core–mantle boundary topography with inner-core boundary (ICB) topography18,19, although alternate explanations have been proposed20,21,22. A reversal of motion inferred from backscattered seismic waves was consistent with the amplitude and phase predicted from the SYO pattern of LOD oscillation19,23.
Apparent inconsistencies with the pattern expected from rotation in changes in PKIKP coda have been argued to preclude interpretation of solid-body IC rotation, and instead indicate structural changes in the IC or at the ICB, or conceivably in the outer core (OC)24,25,26.
To resolve the inconsistency of recent models, here we gather and analyse additional data sensitive to IC changes. We focus on two short-period, medium-aperture seismic arrays in northern North America, the Eielson (ILAR) and Yellowknife (YKA) arrays, which record IC-sensitive PKIKP waves from earthquakes in the South Sandwich Islands (SSI). We compile repeating earthquakes from the literature for 1991–2020, and crucially add 12 new repeating earthquakes for 2021–2023. We carefully examine the seismograms for changes in PKIKP and its coda. The dependence of waveform changes on earthquake pair dates is used to construct a new model for IC rotation.
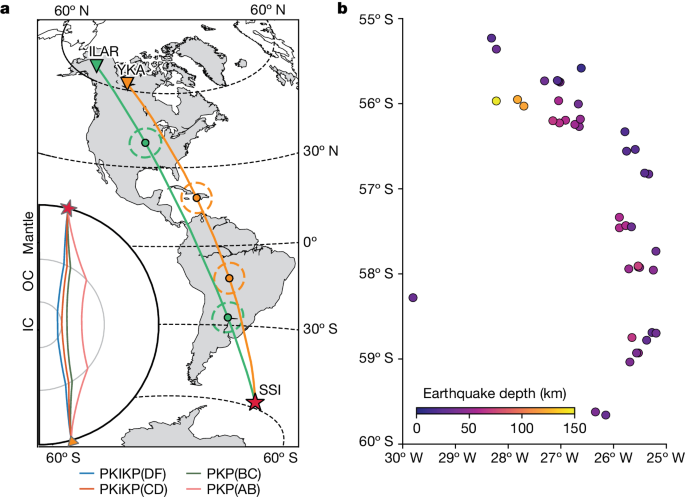
We collected a dense sampling of repeating earthquakes (Fig. 1b). We focus on the region in which IC change was first noted5, and which has clear waveform changes and changes in the time difference between core phases (ddt) over more than 50 years (ref. 27)—the path from the SSI to northern North America (Fig. 1a). This path is close to north–south, a bearing shown to be most likely to reveal waveform changes from IC rotation17. Beamforming greatly improves the signal-to-noise ratio, so we select the high-quality, 20-element ILAR and YKA arrays, which have been recorded for more than 20 years. They were designed with apertures and siting appropriate for capturing clear teleseismic P waves at periods near 1 s.
a, Ray paths of PKIKP and PKP from the SSI source region to the two arrays (ILAR and YKA). The sampled IC region with a representative 1.5 Hz Fresnel zone30 is marked with dashed circles centred at the PKIKP pierce points at the ICB. Inset, the ray paths of PKP (PKP(AB) and PKP(BC)), PKiKP(CD) and PKIKP(DF). b, Map of the SSI region with the source locations coloured by focal depth.
We compile 121 events from 1991 to 2023 (Supplementary Table 1) in 42 locations, including 16 multiplets (Supplementary Table 2) of three to seven events, which span 5° in latitude. The latest 12 events were found with a template search (Methods). These earthquakes form 143 pairs of repeating events (Supplementary Table 3). Between the two arrays, we made 200 waveform pair comparisons. The comparisons were done with stacks across each array (Methods).
Many PKIKP waves showed changes over the years, whereas we noticed no evidence that non-PKIKP phases changed in either arrival time or waveform, including IC-reflected phases. Many examples of these event pairs with changing waveforms have been presented in ref. 17.
We scored PKIKP by visual inspection for all event pairs from both arrays, classifying the waveform match as similar, somewhat similar or different, resulting in 57, 72 and 71 pairs, respectively. There were also 48 pairs too noisy to evaluate and 38 for which data from ILAR, which has the shorter archive, were not available. Almost all of our scores match the interpretation in ref. 17 for the presence or absence of waveform change. More objective scoring is possible17, but some level of subjectivity would remain. Noise level, the time interval that the DF phase is above the noise, amplitude relative to nearby reference phases, character of other nearby repeating pairs and repeater similarity on global stations for non-IC phases all were evaluated, as well as potential differences between repeats in location and source time function. A further complication is that ILAR at 150° and YKA at 135° present PKP waves with distinct patterns of timing and amplitude of PKIKP and PKiKP, and interference with other core phases. The pattern and model described below become clear, in our opinion, and the model predictions should be testable within the next 5–10 years.
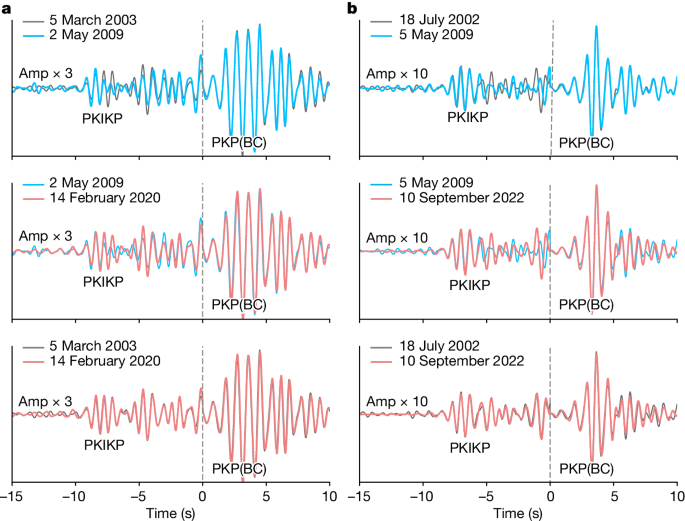
Figure 2 shows two examples of a triplet of event pairs constructed from two three-event multiplets. The middle-event waveform differs from those of the first and last events, which are essentially identical in each case. That is, remarkably, the PKIKP changes then reverts to the original across the three events. One or two such instances could simply indicate that the middle event is anomalous in a variety of possible ways, so we investigate more thoroughly.
The very similar initial first few seconds of most of the repeating-event waveforms is the expected result of scattering in a heterogeneous medium that has shifted. Waveform changes become greater with increasing lag time behind the direct arrival, as was demonstrated by synthetic seismograms in ref. 17.
The results for both arrays for all events, and just the 96 most similar events, are shown in Extended Data Figs. 1–4. Some broad patterns are evident. Pairs in the south show less difference at YKA. Most pairs that start in the early years change waveform. Note that there are fewer pairs for ILAR because of its later starting date for data availability from Incorporated Research Institutions for Seismology (IRIS). These observations are hard to translate into IC motion as plotted.
Notably, some widely separated pairs of events happen with unchanged waveforms, as noted in ref. 17. Even more surprising is that five or so multiplets, spread across the SSI region, change waveform and then change back across a span of a decade or more, as shown in Fig. 2.
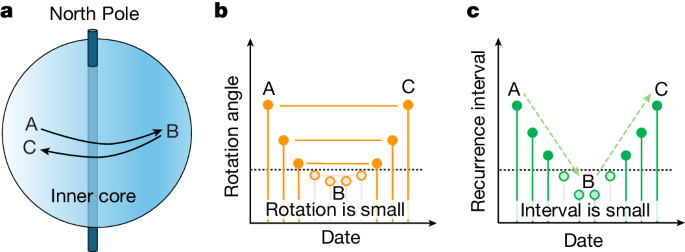
We interpret below that these observations indicate a reversing IC that shifts first in one direction and then back to reoccupy the same position. Further examples of waveforms changing and reverting are shown in Extended Data Fig. 5. In this model, any event pair with matching waveforms at long intervals may well have produced different waveforms if a repeater had ruptured at times in between. Other pairs are similar but change in different pairings from the same multiplet with later or earlier times, as shown in Extended Data Fig. 6, and still others are simply pairs many years apart showing little change in SSI regions in which differently timed pairs generally do show a change. Southern SSI shows strong direct arrivals with weak scattered coda, with all changes more subtle, so we interpret waveform changes that are more subtle, notably in multiplets A and C. Scored changes for multiplet A are shown in Extended Data Fig. 7.
To investigate this model, we consider the dates of pairs with similar and different waveforms against their time separation. The matching pairs of times reveal when a rotation angle is repeated. In the context of previous models, which mostly find super-rotation in our early time span, probably the first repetition in matching repeaters is when the IC is super-rotating, and the later repetition is passing back through that same position while sub-rotating. The model and measurement are shown in Fig. 3.
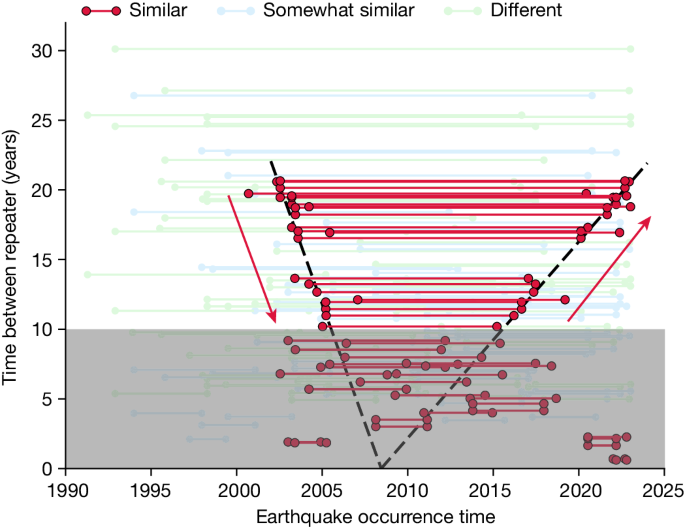
The degree of similarity of the waveforms traversing the IC for all 143 most similar event pairs is shown in Fig. 4. The similar pairs tend to have their midpoint around 2010, with longer intervals of 15–20 years between events that extend farther from 2010, earlier for the first event and later for the second event. This is the pattern expected for an IC that has reversed direction near the date of the midpoint.
The dots are the years of events, the lines connect repeating pairs. The black line on the left shows that the trend of first events in a pair that has progressively shorter intervals occurs progressively later from 2000 to 2005. The black line on the right shows that the second event in a pair that has progressively longer intervals occurs progressively later from 2010 to 2023. Pairs less than 10 years apart are shaded, as just a few years of separation throughout the entire period apparently does not involve enough IC motion to always change the waveform. Lines from the ILAR array pair measurements are raised 0.4 years to visually separate them from the lines from the YKA array for the same event pairs.
The pattern for all pairs, including the short recurrence times, showing which pairs do and do not fit this pattern, is shown differently in Extended Data Fig. 8. It is even more apparent there that for the matching pairs for longer intervals, the prediction in Fig. 3 matches closely the observations.
The shallower slope after 2010 in Fig. 4 indicates slower motion than before 2005, and projects to a reversal occurring in 2008 (Methods). We cannot resolve absolute rotation rate from this plot alone, the plot only measures the polarity and rate ratio between forward and backward rotations. Only asymmetry in rate across the time of reversal can generate the observed change in slopes.
The steeper slope before 2005 compared with that after 2015 shows that the IC motion is 2.5 times slower in the later period, as well as reversed (Methods). The IC motion has thus been more complicated than a symmetric function such as a sinusoid. We cannot trace motion back before about 2002—we see no waveform matches with events then, probably because the IC has not yet sub-rotated back to those positions.
The period between 2005 and 2015 is more difficult to resolve. We interpret that the rotation in this period slows as the IC position reaches an extremum before reversing. The time near the change in direction produces a less definitive pattern of matches and mismatches, as slowing apparently lengthens the time interval over which the IC position remains similar. Waveforms across short intervals sometimes match even far from the turning point, also probably owing to only small changes in IC position.
There may be signs of more activity apart from just IC rotation; some pairs that the model predicts to match do not. More might be learnt from measuring time shifts in the changing waveforms and perhaps beamforming to locate and analyse individual scatterers that evolve between repetitions. Initial examination, not shown, suggests that ILAR ddt measurements do change and then revert in phase with waveforms. Here we simply present IC rotation with repeated waveforms and do not explore the pairs that should match but do not.
An IC that moves in one direction from 2002 to 2005, may not move much for a few years, then slowly backtracks from 2015 to 2023, resembles in broad form the recent years of motion in the model in ref. 27, which postulates a 70-year sinusoid slowing to reverse around 2010. Our measurements confirm the general trend, which had been controversial, and extend the observation period several more years, confirm a reversal and show asymmetry that had been not so clearly resolved. We verify for the first time that the path returns along a similar trajectory, without much wobble in the relative rotation pole.
Our model does not provide a strong test of the model in ref. 17, which suggests an earlier period of more rapid IC motion from 2001 to 2003, preceded and followed by much less motion. Here we see, however, that slow motion persists through most years since and measure its trend and relative speed. Repeating events for these and other source-station paths may well in future years start to match waveforms from still earlier times, elucidating the movement that generated the strong changes in waveforms that our study and ref. 17 observed for repeating pairs crossing the 2001–2003 window.
Our data do not resolve changes at the IC boundary or in the OC26; the PKPBC/CD arrivals do not change noticeably in waveform or timing. However, some earthquake pairs change when little is predicted from rotation and changes are seen when PKIKP and PKiKP overlap, allowing more IC variability than just rotation.
Our observations do not detect our previously favoured model of the mantle–IC gravitational coupling driving SYOs as the primary IC motion23. We note that the inferred change in polarity around 1971 (ref. 23), which is consistent with SYO predictions, is also consistent with the expected timing of an inferred previous reversal in the slow oscillation model27 and a more variable rotation model28. We also note that improved estimates of the magnitude of IC motion necessary to cause the observed LOD oscillations include the likely entrainment of the OC in the tangent cylinder29. This additional inertial mass would reduce by a factor of two or three the angular amplitude of oscillation that would explain the SYOs in LOD, rendering it difficult to seismologically observe.
Our method and observations provide the most definitive evidence so far that the IC is moving relative to the rest of the Earth, and specifically that it is slowly and smoothly rotating on a reversing path. The observation that the westward sub-rotation is less than half as fast as the last part of the eastward super-rotation is well-resolved and begs models with that character. Identification of repeating pairs in which waveform changes and ddt from rotation cancel will allow greater resolution in the question of whether other processes near the IC boundary are also appearing. Examination with these methods of repeating IC waves on other paths, further in the past and into the future, promises rapid progress in monitoring motion in a difficult and enigmatic region.


